8.1 EMP_boxplot
Box plots are statistical charts used to show the distribution of data.
Note:
①The module
②A more comprehensive difference analysis can be performed using the module
①The module
EMP_boxplot is mainly used for the rapid visualization of the results of difference analysis but not the paired test, one-way ANOVA, or Kruskal-wails test.②A more comprehensive difference analysis can be performed using the module
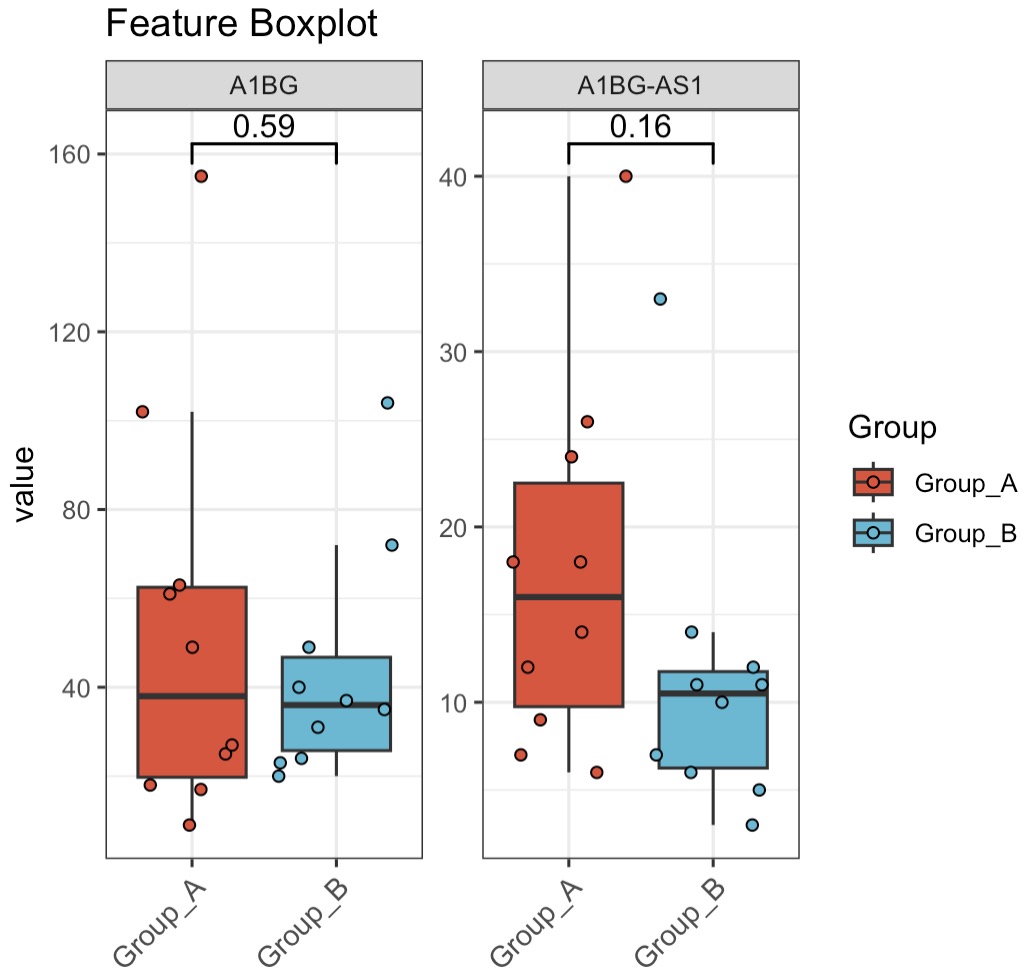
EMP_diff_analysis.8.1.1 Box plots for assay data
🏷️Example:
MAE |>
  EMP_assay_extract('host_gene',pattern = 'A1BG',pattern_ref = 'feature') |>
  EMP_boxplot(method='t.test',estimate_group='Group')
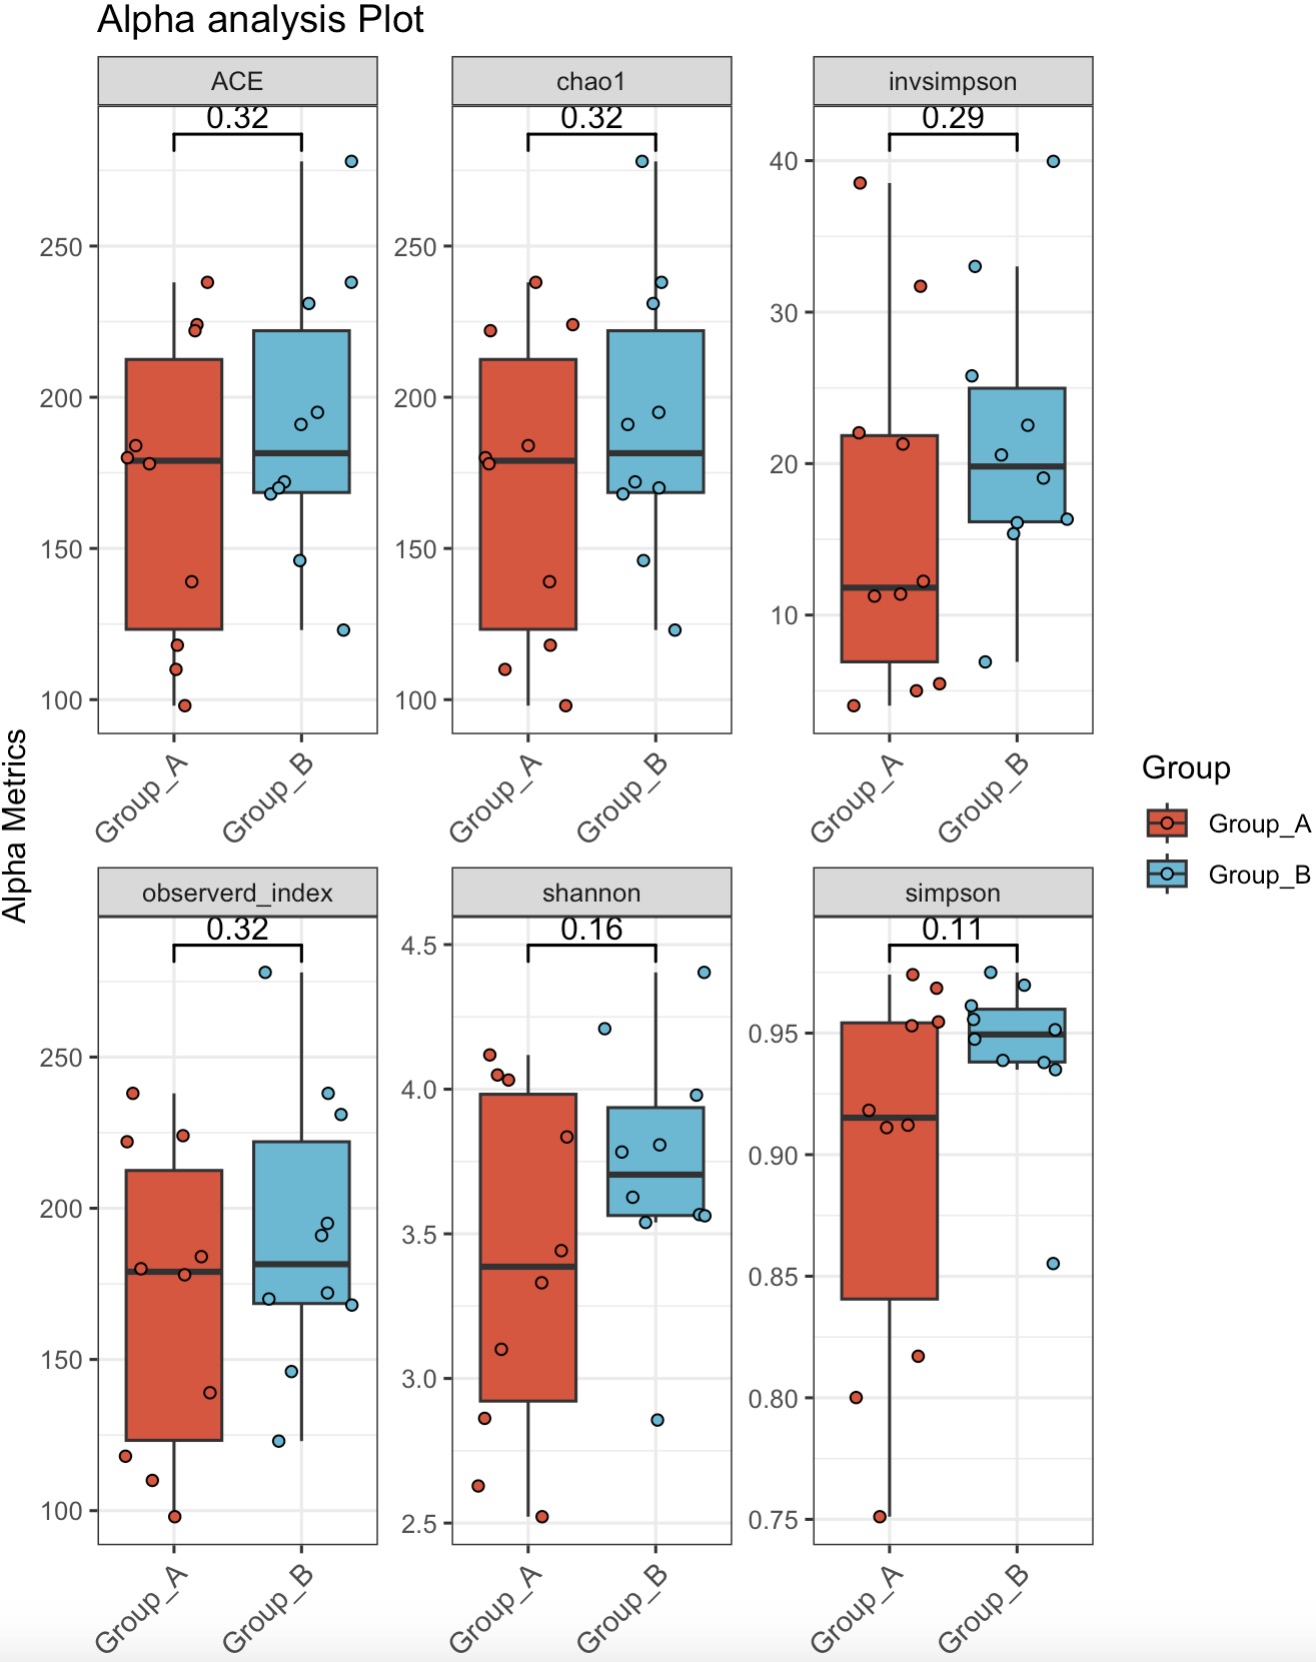
8.1.2 Box plots for alpha analysis result
🏷️Example:
MAE |>
  EMP_assay_extract('taxonomy') |>
  EMP_alpha_analysis()|>
  EMP_boxplot(method='t.test',estimate_group='Group')